

What types of federal and state policy approaches are most effective in expanding broadband access and bridging the digital divide?
Different state policy approaches lead to similar improvements in broadband access, but outcomes vary based on local context and starting conditions.

The similarity in broadband access improvements across both taskforce and funding structure states suggests that no single policy model guarantees success on its own. Instead, the effectiveness of a given approach appears closely tied to each state’s starting conditions and broader policy environment. States that adopted taskforces tended to begin with lower broadband availability, which may point to these strategies being more accessible, lower-cost, or more flexible entry points for states with limited infrastructure or resources. This pattern reinforces the idea that broadband expansion is not just a technical challenge, but one that is shaped by uneven political, economic, and institutional capacities.
These findings raise important considerations for how we evaluate and compare state-level broadband efforts. If different strategies lead to similar aggregate improvements, but states start from vastly different baselines, then the real equity challenge lies not only in how much progress is made, but in who has the capacity to make progress in the first place. This insight complicates the assumption that policy design alone determines outcomes, and points instead to the need for more context-aware assessments of digital inclusion. It also suggests further inquiry into how policy choices are shaped by state-specific constraints—and whether some strategies are systematically underutilized in the places that might benefit from them most.
Distribution of broadband funding across U.S. states reflects geographic disparities.

The FCC’s Rural Digital Opportunity Fund (RDOF) Auction 904, held in 2020, was a federal initiative to expand broadband access in unserved rural areas across the United States. Through this reverse auction, internet service providers bid to receive funding in exchange for committing to build out broadband infrastructure in designated census blocks. The FCC awarded over $9 billion in funding, distributed over ten years, to providers serving these high-need regions. The goal was to bridge the digital divide by prioritizing areas that lacked access to speeds of at least 25 Mbps download and 3 Mbps upload. California and Mississippi received the most funding, while others like Washington D.C. received none. However, when compared to the previous broadband availability and access maps, the correlation is difficult to determine…
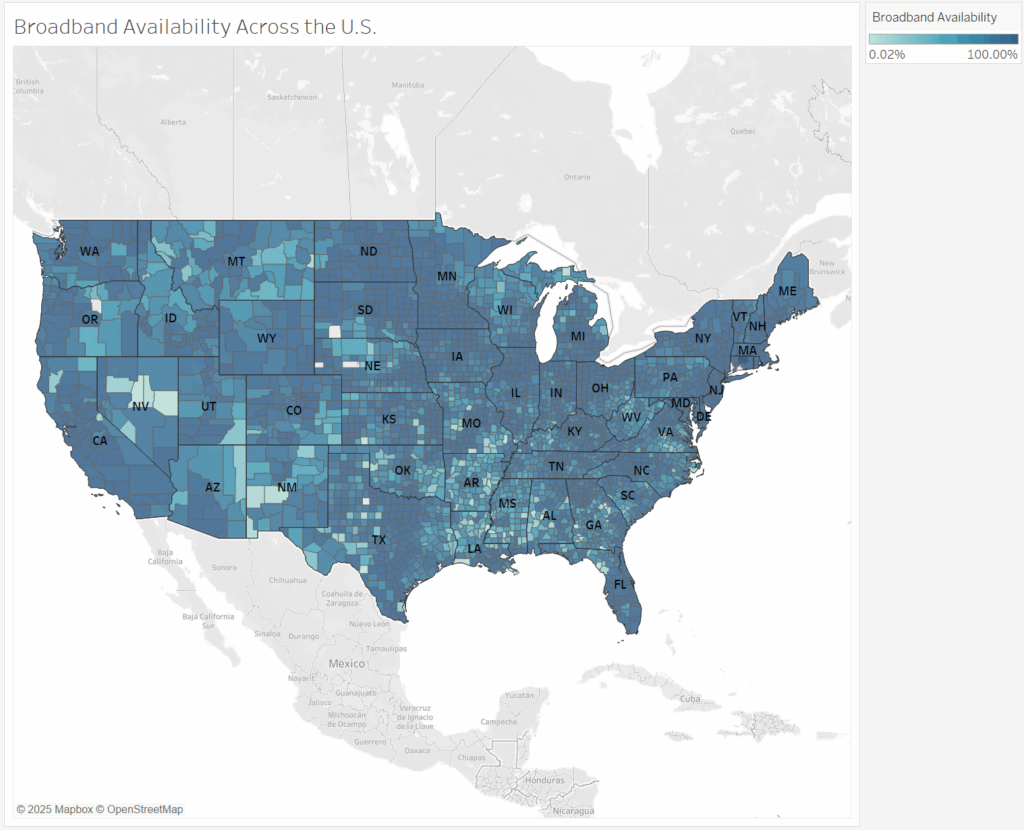
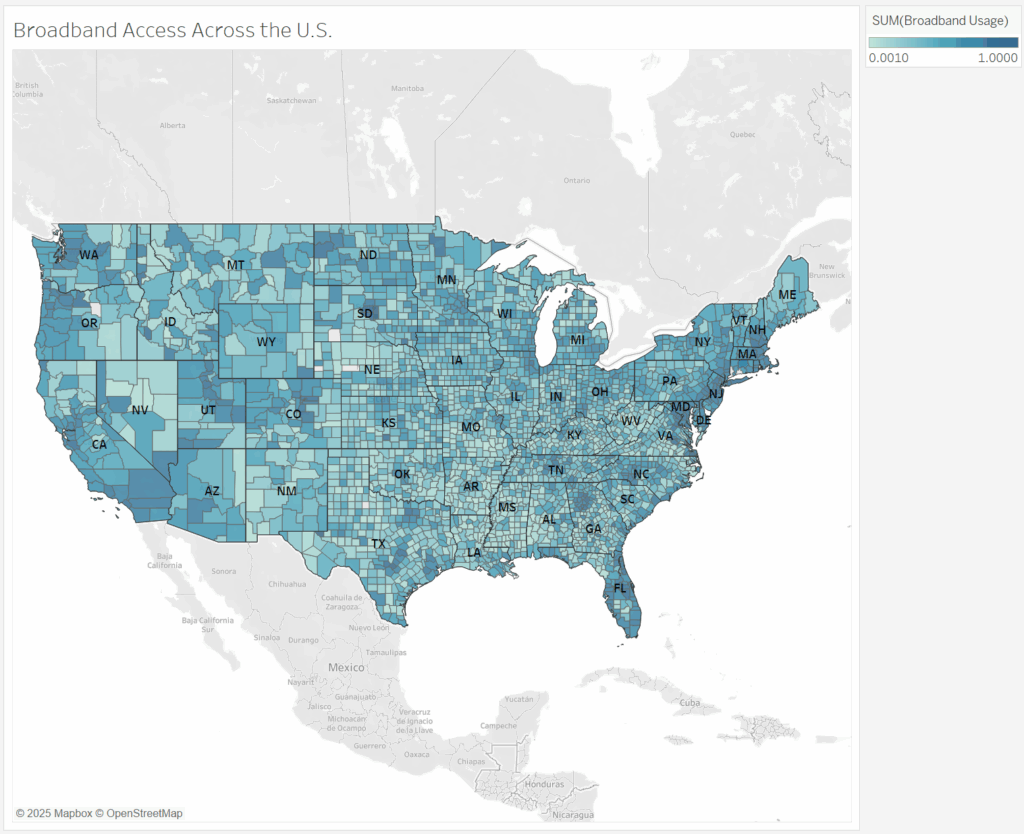
Funding alone doesn’t ensure adoption.

The downward trend in both scatter plots suggests that states receiving more federal broadband funding often had lower existing access and usage, indicating that funding was directed toward areas with greater need. However, the wide spread of data points reveals that investment alone does not ensure high adoption, highlighting persistent barriers such as affordability, digital literacy, and trust. This disconnect between access and usage reinforces a core theme of our project: digital equity requires more than infrastructure – it demands inclusion. The charts raise important questions about the effectiveness of broadband policy and expose hidden variables like income and education that shape outcomes, ultimately illustrating both the potential and the limitations of data-driven approaches while revealing the silences within policy implementation.